1.目的与效果介绍
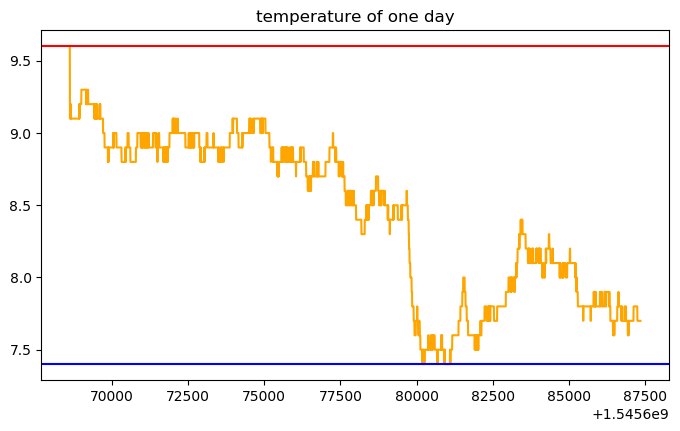
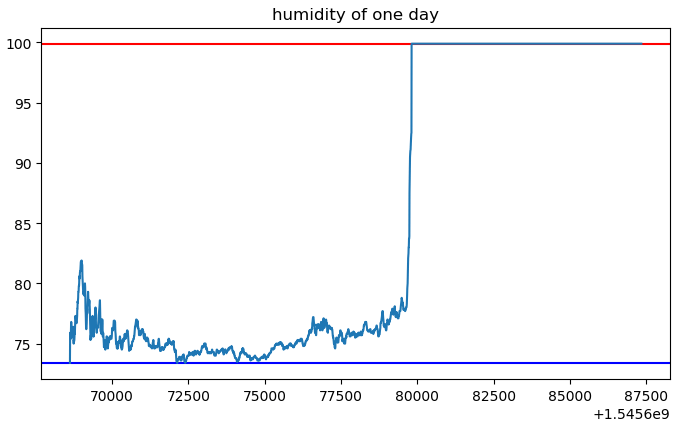
利用温湿度传感器对一段时间内的温度、湿度进行连续观测,并绘制出变化曲线图,如下。
2.硬件准备
主要需要准备温湿度传感器一个,这里我用的是DHT22,接口非常简单,按照之前博客接树莓派的GPIO口就可以了。3.3V和5V都可以。
3.代码编写
代码也比较简单,主要分为数据记录与绘图两部分,完整代码见Github项目:OneDayTemperature。这里主要贴一下部分绘图的代码。
# coding=utf-8
from matplotlib import pyplot as plt
import time


def readData(file_path):
    date_file = open(file_path, 'r')
    linux_times = []
    times = []
    temps = []
    hus = []
    lines = date_file.readlines()
    for item in lines:
        str_item = item.strip("\n")
        str_time = str_item.split(",")[0]
        temp = str_item.split(",")[1]
        hu = str_item.split(",")[2]

        if float(hu) > 100:
            continue

        times.append(time)
        lt = time.strptime(str_time, "%Y-%m-%d %H:%M:%S")
        timeStamp = int(time.mktime(lt))
        linux_times.append(timeStamp)
        temps.append(float(temp))
        hus.append(float(hu))
    return linux_times, times, temps, hus


def drawPlot(times, temps, hus):
    plt.figure(1)
    plt.title("temperature of one day")
    plt.plot(times, temps, color='orange')
    max_temp = max(temps)
    min_temp = min(temps)
    plt.axhline(max_temp, color='red')
    plt.axhline(min_temp, color='blue')
    plt.figure(2)
    plt.title("humidity of one day")
    max_hu = max(hus)
    min_hu = min(hus)
    plt.axhline(max_hu, color='red')
    plt.axhline(min_hu, color='blue')
    plt.plot(times, hus)
    plt.show()


if __name__ == '__main__':
    linux_times, times, temps, hus = readData("records.txt")
    drawPlot(linux_times, temps, hus)
在代码中对于一些错误的观测数据,通过if语句进行了剔除。
5.总结
本篇博客实现的内容比较简单,主要是温湿度传感器的使用以及利用Matplotlib绘图。
本文作者原创,未经许可不得转载,谢谢配合