这篇博客利用Matplotlib绘制带有方向的散点误差图,局部如下。主要内容是如何画箭头。
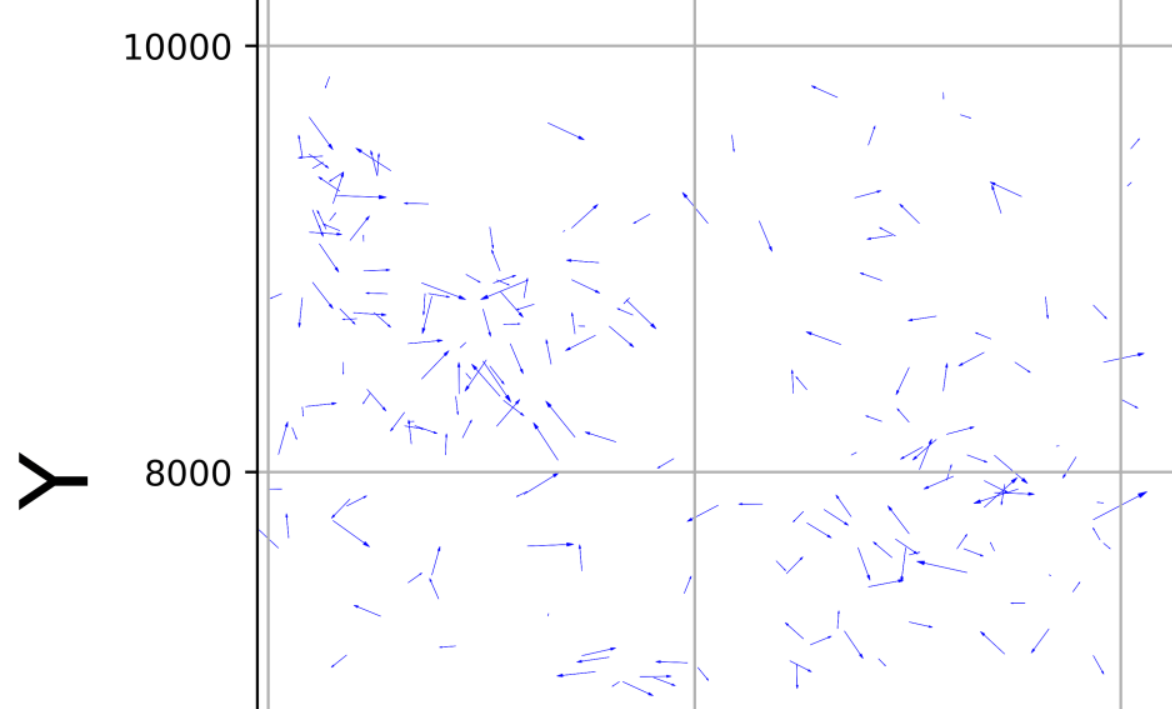 箭头的长短表示误差的大小,方向表示误差的方向。
1.代码
# coding=utf-8
import matplotlib.pyplot as plt
import math
import argparse


def readData(file_path):
    text_file = open(file_path)
    points_x = []
    points_y = []
    errs_x = []
    errs_y = []

    line = text_file.readline().strip('\n')
    while line:
        line = text_file.readline().strip('\n')
        if line != '' and line.startswith("ID_"):
            tmp_elements = line.split("\t")
            points_x.append(float(tmp_elements[1]))
            points_y.append(float(tmp_elements[2]))
            errs_x.append(float(tmp_elements[5]) * 300)
            errs_y.append(float(tmp_elements[6]) * 300)

    print points_x.__len__(), 'points have been read.'
    return points_x, points_y, errs_x, errs_y


def drawPlot(points_x, points_y, errs_x, errs_y,
             arrow_length_ratio=0.15, arrow_width_ratio=0.5, lineWidth=0.15,
             figDpi=600, scale_x=18,
             save_path="figure.png"):
    width = max(points_x) + 100
    height = max(points_y) + 100
    min_x = min(points_x) - 100
    min_y = min(points_y) - 100

    ratio_y = (height + abs(min_y)) / (width + abs(min_x))
    scale_y = int(scale_x * ratio_y)

    for ex, ey in zip(errs_x, errs_y):
        if ex == 0:
            print '0x'
            ex = 0.001
        if ey == 0:
            print '0y'
            ey = 0.001

    print "plotting figure..."
    fig = plt.figure(figsize=(scale_x, scale_y))
    ax = fig.gca()
    ax.set_aspect('equal')
    ax.set_xlim(min_x, width)
    ax.set_ylim(min_y, height)
    plt.title("Errors", fontsize=2 * scale_x)
    ax.set_xlabel("X", fontsize=1.5 * scale_x)
    ax.set_ylabel("Y", fontsize=1.5 * scale_x)
    ax.grid()
    for x, y, dx, dy in zip(points_x, points_y, errs_x, errs_y):
        line_length = math.sqrt(dx * dx + dy * dy)
        ax.arrow(x, y, dx, dy, length_includes_head=True,
                 head_width=line_length * arrow_length_ratio * arrow_width_ratio,
                 head_length=line_length * arrow_length_ratio, fc='b', ec='b', linewidth=lineWidth)
    print 'x range:', min_x, ' - ', width
    print 'y range:', min_y, ' - ', height

    plt.show()
    print "saving figure..."
    plt.savefig(save_path, bbox_inches='tight', dpi=figDpi, pad_inches=0.25)


if __name__ == '__main__':
    parser = argparse.ArgumentParser(description='Script for plotting error figure.')
    parser.add_argument('-input', help='file path for data file')
    parser.add_argument('-arrow_len', default='0.15', help='the ratio of arrow length ang total line length')
    parser.add_argument('-arrow_wid', default='0.5', help='the ratio of arrow width and arrow length')
    parser.add_argument('-line_wid', default='0.15', help='the width of lines')
    parser.add_argument('-dpi', default='600', help='the dpi of output image')
    parser.add_argument('-scale', default='18', help='the number to scale output image')
    parser.add_argument('-output', default='figure.png', help='file path for output file')

    args = parser.parse_args()

    try:
        pts_x, pts_y, errs_x, errs_y = readData(args.input)
        drawPlot(pts_x, pts_y, errs_x, errs_y,
                 arrow_length_ratio=float(args.arrow_len),
                 arrow_width_ratio=float(args.arrow_wid),
                 lineWidth=float(args.line_wid),
                 figDpi=int(args.dpi),
                 scale_x=int(args.scale),
                 save_path=args.output)
    except:
        print 'input \'-h\' to get help information'
完整的测试数据及代码见Github项目,点击查看。
本文作者原创,未经许可不得转载,谢谢配合