在初中化学课上就学过,要想测量溶液的PH值,最简单的办法就是PH试纸。PH试纸而且也很便宜,某宝上不到4块钱一本(80张)还包邮。 本篇博客主要探讨的是利用计算机视觉的方法依据PH标准色卡“精确地”读出PH值。
1.主要思路
思路和方法也很简单,分别获取PH标准色卡不同PH值所对应的颜色(RGB值),如下图所示,再获取测量试纸的颜色RGB值,利用计算机视觉的办法将试纸颜色与标准色卡颜色逐一比较,找到最接近的颜色,即认为是测量的PH值。
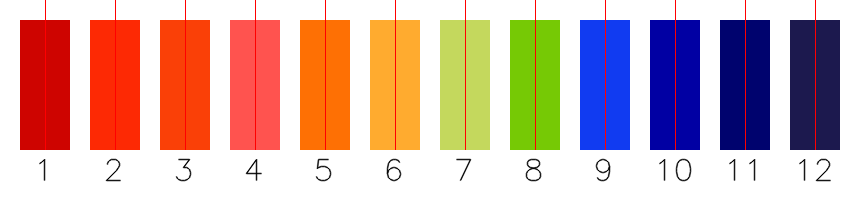 同时为了更加精确,还可以分别获取最相近和次相近颜色,然后做数值内插,即可得到精确到小数的PH值。不同颜色的比较通过计算色彩空间中的距离实现。可以分别将RGB看成三个轴,从而构成了一个三维的色彩空间,空间中的每一个点即代表一种颜色。通过计算测量的颜色与其它各标准颜色的欧氏距离,从而确定最短距离。
2.代码
整理思路比较简单,下面直接放代码。
# coding=utf-8
import cv2
import numpy as np
import math


def interplateColor(color1, color2, weight=0.5):
    c1_1 = color1[0]
    c1_2 = color1[1]
    c1_3 = color1[2]

    c2_1 = color2[0]
    c2_2 = color2[1]
    c2_3 = color2[2]

    c3_1 = int((1 - weight) * c1_1 + weight * c2_1)
    c3_2 = int((1 - weight) * c1_2 + weight * c2_2)
    c3_3 = int((1 - weight) * c1_3 + weight * c2_3)
    return [c3_1, c3_2, c3_3]


def genPhColorPlate(phColor):
    color_bar_width = 50
    color_bar_height = 150
    color_bar_margin = 20
    height = 200
    width = len(phColor) * color_bar_width + (len(phColor) + 1) * color_bar_margin
    blank_img = np.zeros([height, width, 3], np.uint8) + 255
    for i in range(len(phColor)):
        center = color_bar_margin + color_bar_width / 2 + i * (color_bar_width + color_bar_margin)
        blank_img[color_bar_margin:color_bar_height,
        center - color_bar_width / 2:center + color_bar_width / 2] = \
            phColor[i]
        blank_img[:color_bar_height, center] = [0, 0, 255]
        if i >= 9:
            cv2.putText(blank_img, (i + 1).__str__(),
                        (center - 22, color_bar_height + 30),
                        cv2.FONT_HERSHEY_SIMPLEX,
                        1, (0, 0, 0), 1, cv2.LINE_AA)
        else:
            cv2.putText(blank_img, (i + 1).__str__(),
                        (center - 12, color_bar_height + 30),
                        cv2.FONT_HERSHEY_SIMPLEX,
                        1, (0, 0, 0), 1, cv2.LINE_AA)
    return blank_img


def getPhValueInt(color, phColor):
    dists = []
    for i in range(len(phColor)):
        dist = math.sqrt(
            pow(color[0] - phColor[i][0], 2) + pow(color[1] - phColor[i][1], 2) + pow(color[2] - phColor[i][2], 2))
        print dist
        dists.append(dist)
    return dists.index(min(dists)) + 1


def getPhValueFloat(color, phColor):
    dists = []
    for i in range(len(phColor)):
        dist = math.sqrt(
            pow(color[0] - phColor[i][0], 2) + pow(color[1] - phColor[i][1], 2) + pow(color[2] - phColor[i][2], 2))
        dists.append(dist)
    min_index1 = dists.index(min(dists))
    dist1 = dists[min_index1]
    dists[min_index1] = 999999
    min_index2 = dists.index(min(dists))
    dist2 = dists[min_index2]
    if min_index1 <= min_index2:
        final_ph = min_index1 + abs(min_index1 - min_index2) * (dist1 / (dist1 + dist2))
    else:
        final_ph = min_index1 - abs(min_index1 - min_index2) * (dist1 / (dist1 + dist2))
    return final_ph + 1, min_index1 + 1, min_index2 + 1


def drawPh(ph_color, ph_val, phColor):
    ph_img = genPhColorPlate(phColor)
    color_bar_width = 50
    color_bar_margin = 20
    color_bar_height = 150
    ph = ph_val[0] - 1
    ph1 = ph_val[1] - 1
    ph2 = ph_val[2] - 1
    if ph1 > ph2:
        tmp = ph1
        ph1 = ph2
        ph2 = tmp
    start_pix = color_bar_margin + color_bar_width / 2 + ph1 * (color_bar_width + color_bar_margin)
    end_pix = color_bar_margin + color_bar_width / 2 + ph2 * (color_bar_width + color_bar_margin)
    loc = int((ph - ph1) * (end_pix - start_pix) + start_pix)
    ph_img[:, loc - 1:loc + 1] = ph_color
    cv2.putText(ph_img, "PH=" + round(ph_val[0], 2).__str__(),
                (loc + 1, color_bar_height + 45),
                cv2.FONT_HERSHEY_SIMPLEX,
                0.4, ph_color, 1, cv2.LINE_AA)
    return ph_img


if __name__ == '__main__':
    phColor = []
    phColor.append([0, 4, 206])
    phColor.append([4, 41, 253])
    phColor.append([7, 64, 250])
    phColor.append([79, 83, 255])
    phColor.append([4, 112, 254])
    phColor.append([47, 171, 255])
    phColor.append([93, 216, 196])
    phColor.append([5, 201, 118])
    phColor.append([241, 59, 17])
    phColor.append([163, 0, 1])
    phColor.append([110, 3, 0])
    phColor.append([78, 25, 28])

    # 顺序为BGR
    ph_color = [79, 83, 200]
    ph_val = getPhValueFloat(ph_color, phColor)
    print 'ph', ph_val[0]
    ph_img = drawPh(ph_color, ph_val, phColor)
    cv2.imwrite("PH" + round(ph_val[0], 2).__str__() + ".png", ph_img)
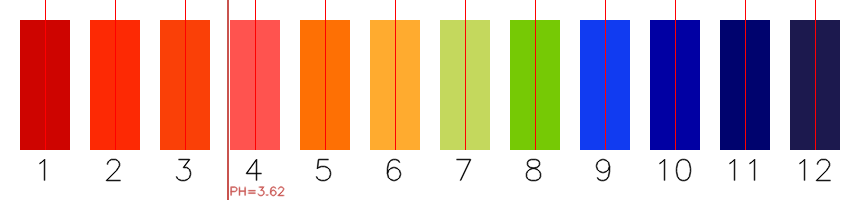
运行上述代码,可以得到该颜色对应的PH值约为3.62,如下图所示。
 至此,便完成了一开始提出的目标。完整代码和测试数据放在Github上,点击查看。
3.总结
本文从纯视觉角度对PH试纸的数值判读进行了实现,其本质上类似于测量里的“估读”,提供PH测量读数的另一种思路和方法。相比于人工比色只能比到整数而言,利用代码可以精确到小数,同时也可以避免一些人为的主观因素对结果造成的影响,如色弱、色盲等。 但其准确性还有待进一步检验,在实际测量过程中,环境光对色彩的影响也不可忽视,而且PH值本身也并非线性变化,在不同PH值之间采用线性内插是否科学也有待进一步验证。
本文作者原创,未经许可不得转载,谢谢配合